URA's final 3Q2026 statistics, released on 23 Oct 2026, show private home prices up 1.4%, matching its 1 Oct flash, with landed up 2.9% and non-landed up 1.0%. HDB's final data of the same date put its resale price index at 202.5, down 0.1%, the third straight quarterly fall. Developers sold 1,183 new homes, excluding ECs.
The numbers
Private homes (URA)
| Segment | 3Q2026 QoQ (final, 23 Oct) | 3Q2026 QoQ (flash, 1 Oct) | 2Q2026 QoQ (as stated 23 Oct) |
|---|---|---|---|
| All private | +1.4% | +1.4% | +0.5% |
| Non-landed | +1.0% | +0.9% | -0.1% |
| Core Central Region | +0.3% | -0.1% | +1.8% |
| Rest of Central Region | Unchanged | +0.2% | -1.2% |
| Outside Central Region | +2.3% | +2.2% | -0.1% |
| Landed | +2.9% | +2.8% | +2.5% |
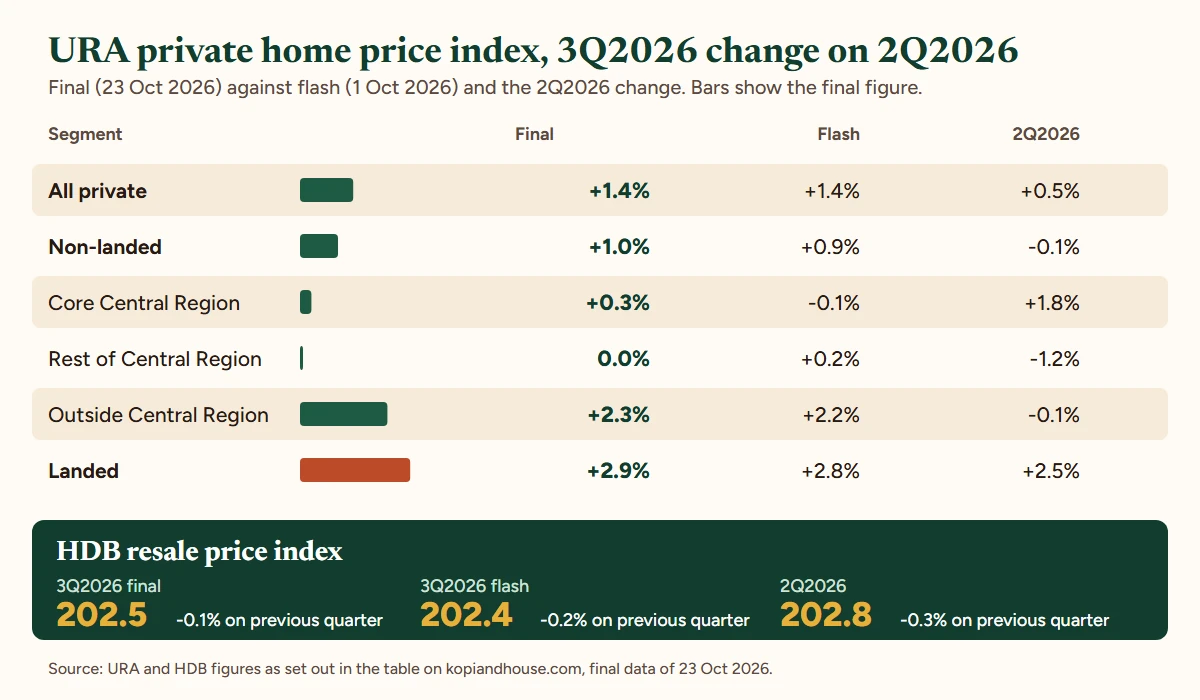
URA also said the overall index rose an average of 0.9% per quarter across the first three quarters of 2026.
What changed from the flash
- The overall index stayed at +1.4%.
- Non-landed moved from +0.9% to +1.0%, and landed from +2.8% to +2.9%.
- The Core Central Region moved from a 0.1% fall in the flash to a 0.3% rise.
- The Rest of Central Region moved from +0.2% to unchanged.
- The Outside Central Region moved from +2.2% to +2.3%.
- The 2Q2026 comparison figures in the final release are the same as those in the flash release.
Rents
| Rental index | 3Q2026 QoQ | 2Q2026 QoQ |
|---|---|---|
| All private | +1.3% | +0.7% |
| Non-landed | +1.2% | +0.4% |
| Core Central Region | -0.3% | +1.2% |
| Rest of Central Region | +1.5% | Unchanged |
| Outside Central Region | +3.1% | -0.3% |
| Landed | +2.1% | +2.7% |
Sales, launches and supply
Developers launched 1,140 new private homes in 3Q2026, excluding ECs, against 1,783 in 2Q, and sold 1,183, against 2,141. No ECs were launched in either quarter, and 68 EC units were sold, against 175. Resale transactions came to 3,801, against 3,813 in 2Q, and made up 73.9% of all sales, against 62.0%. Sub-sales were 162.
Completions reached 3,559 units including ECs, against 1,212 in 2Q. The vacancy rate for completed private homes, excluding ECs, rose to 7.2% from 6.4%: 8.4% in the CCR, 7.4% in the RCR and 6.5% in the OCR.
At the end of 3Q2026, 44,738 units including ECs had planning approval, and 20,300 of them were unsold. Another 12,508 unsold units had no approval yet. URA says about 32,800 units could be available for sale in the next one to two years. About 57,200 units are expected to complete in the coming years: about 22,300 by 2028 and about 34,900 from 2029. The 2H2026 Confirmed List of the Government Land Sales programme adds about 4,745 units, including 735 EC units, for a full-year Confirmed List of 9,320 units.
HDB resale (HDB)
| Measure | 3Q2026 final (23 Oct) | 3Q2026 flash (1 Oct) | 2Q2026 |
|---|---|---|---|
| Resale price index | 202.5 | 202.4 | 202.8 |
| Change on the previous quarter | -0.1% | -0.2% | -0.3% |
| Resale transactions | 7,645 | 7,528 (to 29 Sep 2026) | 6,396 |
| Volume change | +19.5% on 2Q2026; +5.9% on 7,221 in 3Q2025 | +5.2% on the same period of 2025 | Not applicable |
The index fell for a third quarter in a row, after 0.1% in 1Q2026 and 0.3% in 2Q2026. HDB says it has not seen a significant rise in the prices or numbers of resale flats bought by private property owners and ex-owners since it removed their 15-month wait-out period on 28 Jul 2026. On rentals, approved applications to rent out flats were 9,381 in 3Q2026, against 10,002 in 2Q, and 59,378 flats were rented out at the end of the quarter.
HDB also said the November 2026 Build-To-Order exercise will offer about 7,960 flats in Bedok, Geylang, Sembawang, Tengah, Toa Payoh and Yishun. See HDB's sales exercise page for the details.
How to read it
- Our reading: the private rise was led by the OCR and by landed homes. In the CCR the flash estimate showed a fall, and the final figure is a small rise. The RCR was flat.
- Our reading: HDB's final is a touch firmer than its flash, but resale prices have still slipped for three quarters running, while volume is higher than a year earlier.
- An index is an average. Prices differ widely by project, town and flat type.
- Our market data page explains what each index measures, and the 1 Oct 2026 flash figures are in our flash report.
Frequently asked questions
Did private home prices rise in 3Q2026?
Yes. URA's final statistics of 23 Oct 2026 show the overall index up 1.4% from 2Q2026, the same as its flash estimate of 1 Oct 2026. Non-landed rose 1.0% and landed 2.9%.
How did the final figures differ from the flash estimate?
The overall index did not change. Non-landed went from +0.9% to +1.0%, landed from +2.8% to +2.9%, the CCR from -0.1% to +0.3%, the RCR from +0.2% to unchanged, and the OCR from +2.2% to +2.3%.
Which region saw the biggest rise in 3Q2026?
The Outside Central Region. URA's final figures show non-landed prices there up 2.3%, against 0.3% in the Core Central Region and no change in the Rest of Central Region.
How many new homes did developers sell in 3Q2026?
URA counted 1,183 new private homes sold by developers, excluding ECs, down from 2,141 in 2Q2026. Developers launched 1,140 units in the quarter, against 1,783 in 2Q2026.
Did HDB resale prices fall in 3Q2026?
Yes, slightly. HDB's final data of 23 Oct 2026 put the resale price index at 202.5, down 0.1% from 2Q2026. Its 1 Oct 2026 flash estimate had said 202.4, down 0.2%. It is the third quarterly fall in a row.
How many HDB resale flats changed hands in 3Q2026?
7,645, according to HDB's final data of 23 Oct 2026. That is 19.5% more than the 6,396 in 2Q2026 and 5.9% more than the 7,221 in 3Q2025.